README.md
1# Simpleperf
2
3Simpleperf is a native CPU profiling tool for Android. It can be used to profile
4both Android applications and native processes running on Android. It can
5profile both Java and C++ code on Android. The simpleperf executable can run on Android >=L,
6and Python scripts can be used on Android >= N.
7
8Simpleperf is part of the Android Open Source Project.
9The source code is [here](https://android.googlesource.com/platform/system/extras/+/master/simpleperf/).
10The latest document is [here](https://android.googlesource.com/platform/system/extras/+/master/simpleperf/doc/README.md).
11
12[TOC]
13
14## Introduction
15
16An introduction slide deck is [here](./introduction.pdf).
17
18Simpleperf contains two parts: the simpleperf executable and Python scripts.
19
20The simpleperf executable works similar to linux-tools-perf, but has some specific features for
21the Android profiling environment:
22
231. It collects more info in profiling data. Since the common workflow is "record on the device, and
24 report on the host", simpleperf not only collects samples in profiling data, but also collects
25 needed symbols, device info and recording time.
26
272. It delivers new features for recording.
28 1) When recording dwarf based call graph, simpleperf unwinds the stack before writing a sample
29 to file. This is to save storage space on the device.
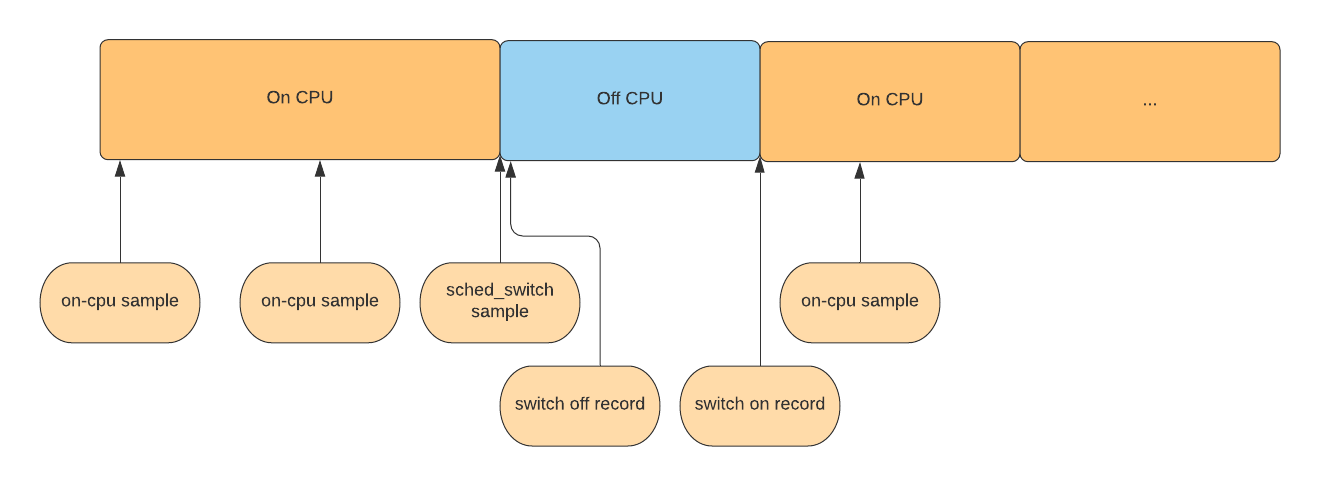
30 2) Support tracing both on CPU time and off CPU time with --trace-offcpu option.
31 3) Support recording callgraphs of JITed and interpreted Java code on Android >= P.
32
333. It relates closely to the Android platform.
34 1) Is aware of Android environment, like using system properties to enable profiling, using
35 run-as to profile in application's context.
36 2) Supports reading symbols and debug information from the .gnu_debugdata section, because
37 system libraries are built with .gnu_debugdata section starting from Android O.
38 3) Supports profiling shared libraries embedded in apk files.
39 4) It uses the standard Android stack unwinder, so its results are consistent with all other
40 Android tools.
41
424. It builds executables and shared libraries for different usages.
43 1) Builds static executables on the device. Since static executables don't rely on any library,
44 simpleperf executables can be pushed on any Android device and used to record profiling data.
45 2) Builds executables on different hosts: Linux, Mac and Windows. These executables can be used
46 to report on hosts.
47 3) Builds report shared libraries on different hosts. The report library is used by different
48 Python scripts to parse profiling data.
49
50Detailed documentation for the simpleperf executable is [here](#executable-commands-reference).
51
52Python scripts are split into three parts according to their functions:
53
541. Scripts used for recording, like app_profiler.py, run_simpleperf_without_usb_connection.py.
55
562. Scripts used for reporting, like report.py, report_html.py, inferno.
57
583. Scripts used for parsing profiling data, like simpleperf_report_lib.py.
59
60Detailed documentation for the Python scripts is [here](#scripts-reference).
61
62
63## Tools in simpleperf
64
65The simpleperf executables and Python scripts are located in simpleperf/ in ndk releases, and in
66system/extras/simpleperf/scripts/ in AOSP. Their functions are listed below.
67
68bin/: contains executables and shared libraries.
69
70bin/android/${arch}/simpleperf: static simpleperf executables used on the device.
71
72bin/${host}/${arch}/simpleperf: simpleperf executables used on the host, only supports reporting.
73
74bin/${host}/${arch}/libsimpleperf_report.${so/dylib/dll}: report shared libraries used on the host.
75
76*.py, inferno, purgatorio: Python scripts used for recording and reporting. Details are in [scripts_reference.md](scripts_reference.md).
77
78
79## Android application profiling
80
81See [android_application_profiling.md](./android_application_profiling.md).
82
83
84## Android platform profiling
85
86See [android_platform_profiling.md](./android_platform_profiling.md).
87
88
89## Executable commands reference
90
91See [executable_commands_reference.md](./executable_commands_reference.md).
92
93
94## Scripts reference
95
96See [scripts_reference.md](./scripts_reference.md).
97
98## View the profile
99
100See [view_the_profile.md](./view_the_profile.md).
101
102## Answers to common issues
103
104### Why we suggest profiling on Android >= N devices?
105
1061. Running on a device reflects a real running situation, so we suggest
107 profiling on real devices instead of emulators.
1082. To profile Java code, we need ART running in oat mode, which is only
109 available >= L for rooted devices, and >= N for non-rooted devices.
1103. Old Android versions are likely to be shipped with old kernels (< 3.18),
111 which may not support profiling features like recording dwarf based call graphs.
1124. Old Android versions are likely to be shipped with Arm32 chips. In Arm32
113 mode, recording stack frame based call graphs doesn't work well.
114
115### Suggestions about recording call graphs
116
117Below is our experiences of dwarf based call graphs and stack frame based call graphs.
118
119dwarf based call graphs:
1201. Need support of debug information in binaries.
1212. Behave normally well on both ARM and ARM64, for both fully compiled Java code and C++ code.
1223. Can only unwind 64K stack for each sample. So usually can't show complete flamegraph. But
123 probably is enough for users to identify hot places.
1244. Take more CPU time than stack frame based call graphs. So the sample frequency is suggested
125 to be 1000 Hz. Thus at most 1000 samples per second.
126
127stack frame based call graphs:
1281. Need support of stack frame registers.
1292. Don't work well on ARM. Because ARM is short of registers, and ARM and THUMB code have different
130 stack frame registers. So the kernel can't unwind user stack containing both ARM/THUMB code.
1313. Also don't work well on fully compiled Java code on ARM64. Because the ART compiler doesn't
132 reserve stack frame registers.
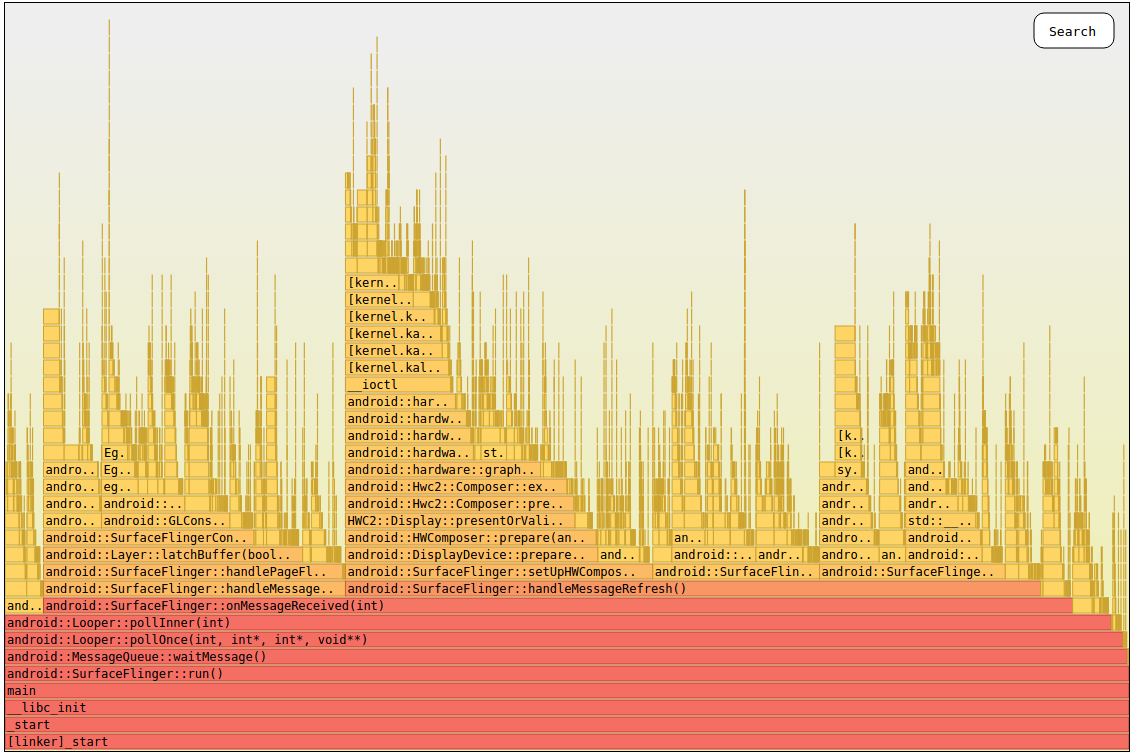
1334. Work well when profiling native programs on ARM64. One example is profiling surfacelinger. And
134 usually shows complete flamegraph when it works well.
1355. Take less CPU time than dwarf based call graphs. So the sample frequency can be 4000 Hz or
136 higher.
137
138So if you need to profile code on ARM or profile fully compiled Java code, dwarf based call graphs
139may be better. If you need to profile C++ code on ARM64, stack frame based call graphs may be
140better. After all, you can always try dwarf based call graph first, because it always produces
141reasonable results when given unstripped binaries properly. If it doesn't work well enough, then
142try stack frame based call graphs instead.
143
144Simpleperf may need unstripped native binaries on the device to generate good dwarf based call
145graphs. It can be supported by downloading unstripped native libraries on device, as [here](#fix-broken-callchain-stopped-at-c-functions).
146
147### Why we can't always get complete DWARF-based call graphs?
148
149DWARF-based call graphs are generated by unwinding thread stacks. When a sample is generated, up to
15064KB stack data is dumped by the kernel. By unwinding the stack based on dwarf information, we get
151a callchain. But the thread stack can be much longer than 64KB. In that case, we can't unwind to
152the thread start point.
153
154To alleviate the problem, simpleperf joins callchains after recording them. If two callchains of
155a thread have an entry containing the same ip and sp address, then simpleperf tries to join them to
156make the callchains longer. In that case, the longer we run, the more samples we get. This makes it
157more likely to get complete callchains, but it's still not guaranteed to get complete call graphs.
158
159### How to solve missing symbols in report?
160
161The simpleperf record command collects symbols on device in perf.data. But if the native libraries
162you use on device are stripped, this will result in a lot of unknown symbols in the report. A
163solution is to build binary_cache on host.
164
165```sh
166# Collect binaries needed by perf.data in binary_cache/.
167$ ./binary_cache_builder.py -lib NATIVE_LIB_DIR,...
168```
169
170The NATIVE_LIB_DIRs passed in -lib option are the directories containing unstripped native
171libraries on host. After running it, the native libraries containing symbol tables are collected
172in binary_cache/ for use when reporting.
173
174```sh
175$ ./report.py --symfs binary_cache
176
177# report_html.py searches binary_cache/ automatically, so you don't need to
178# pass it any argument.
179$ ./report_html.py
180```
181
182### Fix broken callchain stopped at C functions
183
184When using dwarf based call graphs, simpleperf generates callchains during recording to save space.
185The debug information needed to unwind C functions is in .debug_frame section, which is usually
186stripped in native libraries in apks. To fix this, we can download unstripped version of native
187libraries on device, and ask simpleperf to use them when recording.
188
189To use simpleperf directly:
190
191```sh
192# create native_libs dir on device, and push unstripped libs in it (nested dirs are not supported).
193$ adb shell mkdir /data/local/tmp/native_libs
194$ adb push <unstripped_dir>/*.so /data/local/tmp/native_libs
195# run simpleperf record with --symfs option.
196$ adb shell simpleperf record xxx --symfs /data/local/tmp/native_libs
197```
198
199To use app_profiler.py:
200
201```sh
202$ ./app_profiler.py -lib <unstripped_dir>
203```
204
205### Show annotated source code and disassembly
206
207To show hot places at source code and instruction level, we need to show source code and
208disassembly with event count annotation. Simpleperf supports showing annotated source code and
209disassembly for C++ code and fully compiled Java code. Simpleperf supports two ways to do it:
210
2111. Through report_html.py:
212 1) Generate perf.data and pull it on host.
213 2) Generate binary_cache, containing elf files with debug information. Use -lib option to add
214 libs with debug info. Do it with
215 `binary_cache_builder.py -i perf.data -lib <dir_of_lib_with_debug_info>`.
216 3) Use report_html.py to generate report.html with annotated source code and disassembly,
217 as described [here](https://android.googlesource.com/platform/system/extras/+/master/simpleperf/doc/scripts_reference.md#report_html_py).
218
2192. Through pprof.
220 1) Generate perf.data and binary_cache as above.
221 2) Use pprof_proto_generator.py to generate pprof proto file. `pprof_proto_generator.py`.
222 3) Use pprof to report a function with annotated source code, as described [here](https://android.googlesource.com/platform/system/extras/+/master/simpleperf/doc/scripts_reference.md#pprof_proto_generator_py).
223
224## Bugs and contribution
225
226Bugs and feature requests can be submitted at https://github.com/android/ndk/issues.
227Patches can be uploaded to android-review.googlesource.com as [here](https://source.android.com/setup/contribute/),
228or sent to email addresses listed [here](https://android.googlesource.com/platform/system/extras/+/master/simpleperf/OWNERS).
229
230If you want to compile simpleperf C++ source code, follow below steps:
2311. Download AOSP main branch as [here](https://source.android.com/setup/build/requirements).
2322. Build simpleperf.
233```sh
234$ . build/envsetup.sh
235$ lunch aosp_arm64-userdebug
236$ mmma system/extras/simpleperf -j30
237```
238
239If built successfully, out/target/product/generic_arm64/system/bin/simpleperf is for ARM64, and
240out/target/product/generic_arm64/system/bin/simpleperf32 is for ARM.
241