

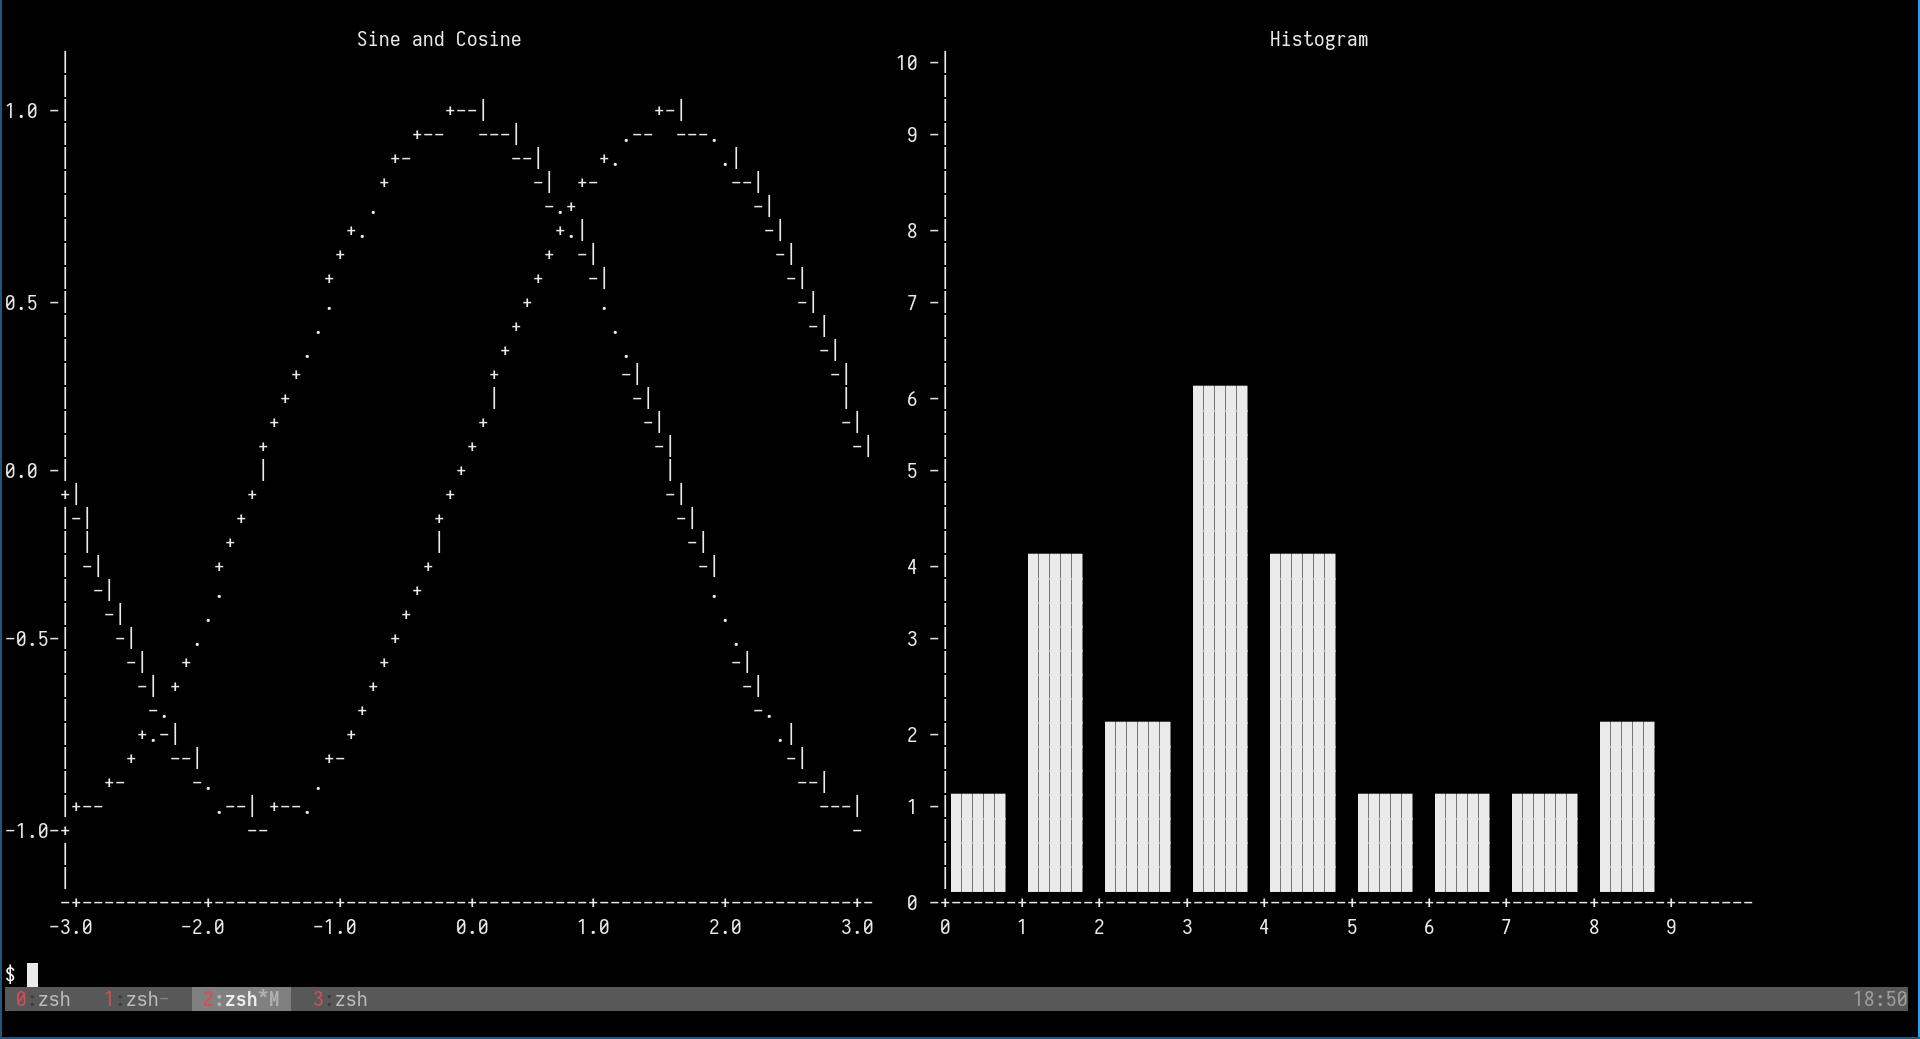


 ## Interactive Tutorial with Jupyter Notebook
*This tutorial is now working in progress and isn't complete*
Thanks to the evcxr, now we have an interactive tutorial for Plotters!
To use the interactive notebook, you must have Jupyter and evcxr installed on your computer.
Follow the instruction on [this page](https://github.com/google/evcxr/tree/master/evcxr_jupyter) below to install it.
After that, you should be able to start your Jupyter server locally and load the tutorial!
```bash
git clone https://github.com/38/plotters-doc-data
cd plotteres-doc-data
jupyter notebook
```
And select the notebook called `evcxr-jupyter-integration.ipynb`.
Also, there's a static HTML version of this notebook available at the [this location](https://plotters-rs.github.io/plotters-doc-data/evcxr-jupyter-integration.html)
## Plotting in Rust
Rust is a perfect language for data visualization. Although there are many mature visualization libraries in many different languages.
But Rust is one of the best languages fits the need.
* **Easy to use** Rust has a very good iterator system built into the standard library. With the help of iterators,
Plotting in Rust can be as easy as most of the high-level programming languages. The Rust based plotting library
can be very easy to use.
* **Fast** If you need rendering a figure with trillions of data points,
Rust is a good choice. Rust's performance allows you to combine data processing step
and rendering step into a single application. When plotting in high-level programming languages,
e.g. Javascript or Python, data points must be down-sampled before feeding into the plotting
program because of the performance considerations. Rust is fast enough to do the data processing and visualization
within a single program. You can also integrate the
figure rendering code into your application handling a huge amount of data and visualize it in real-time.
* **WebAssembly Support** Rust is one of few the language with the best WASM support. Plotting in Rust could be
very useful for visualization on a web page and would have a huge performance improvement comparing to Javascript.
## Plotting on HTML5 canvas with WASM Backend
Plotters currently supports backend that uses the HTML5 canvas. To use the WASM support, you can simply use
`CanvasBackend` instead of other backend and all other API remains the same!
There's a small demo for Plotters + WASM available at [here](https://github.com/plotters-rs/plotters-wasm-demo).
To play with the deployed version, follow this [link](https://plotters-rs.github.io/wasm-demo/www/index.html).
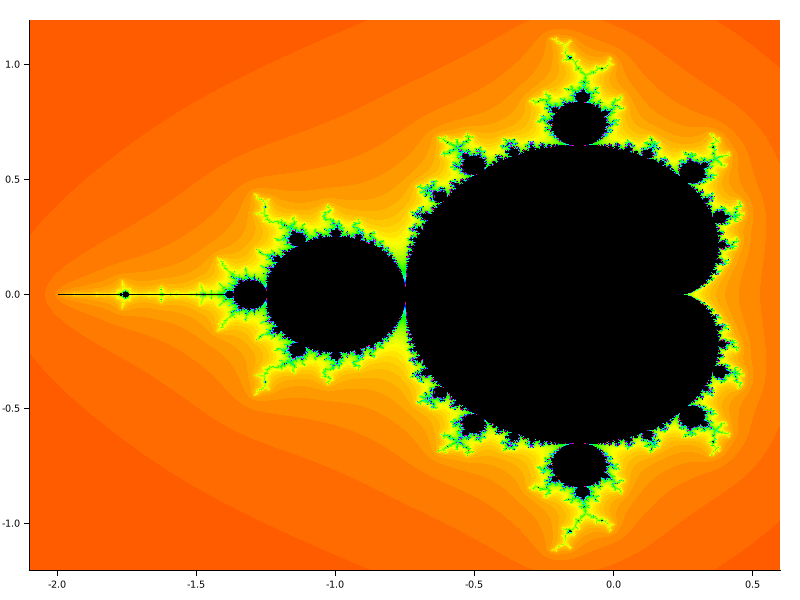
## What types of figure are supported?
Plotters is not limited to any specific type of figure.
You can create your own types of figures easily with the Plotters API.
But Plotters provides some builtin figure types for convenience.
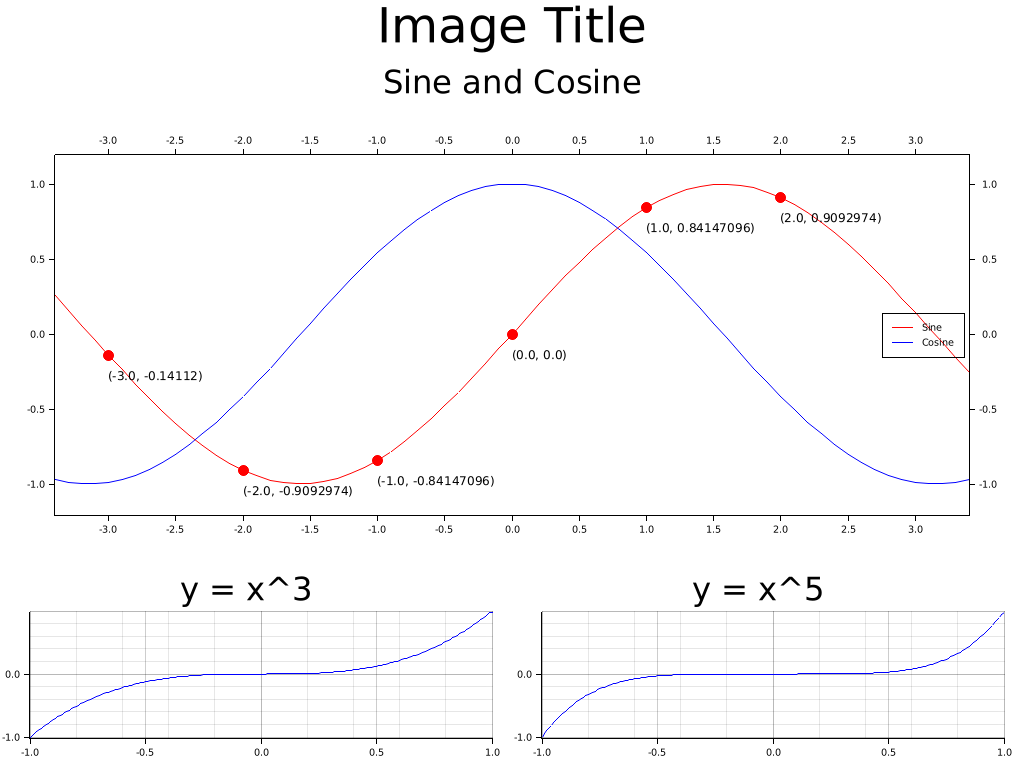
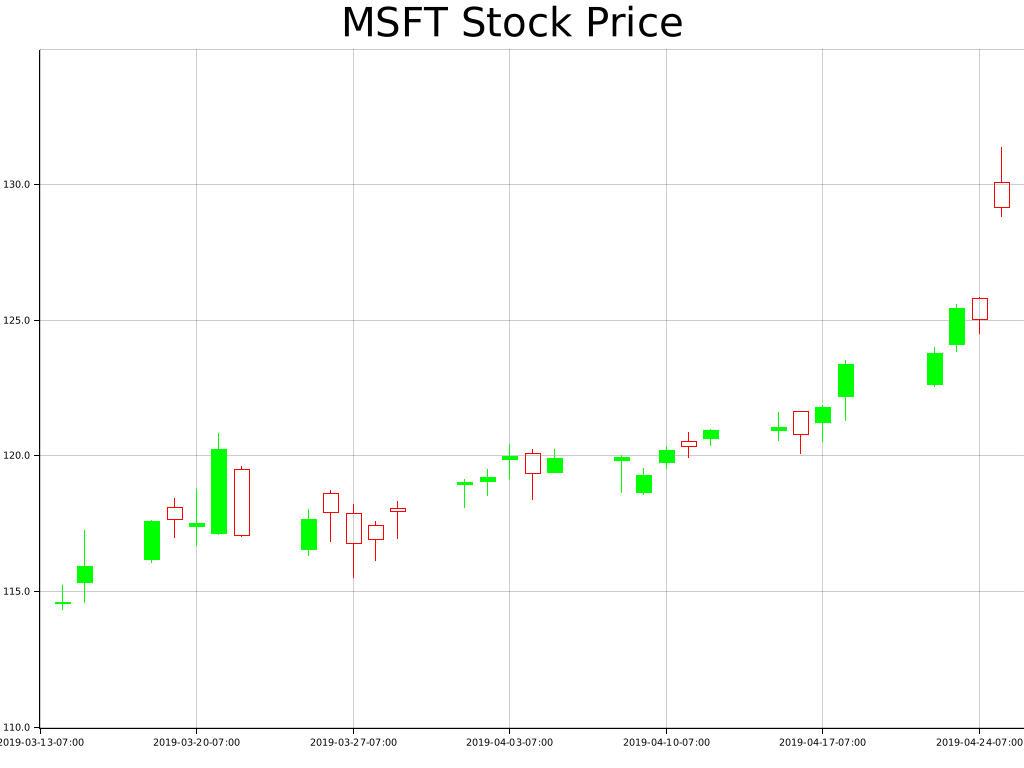
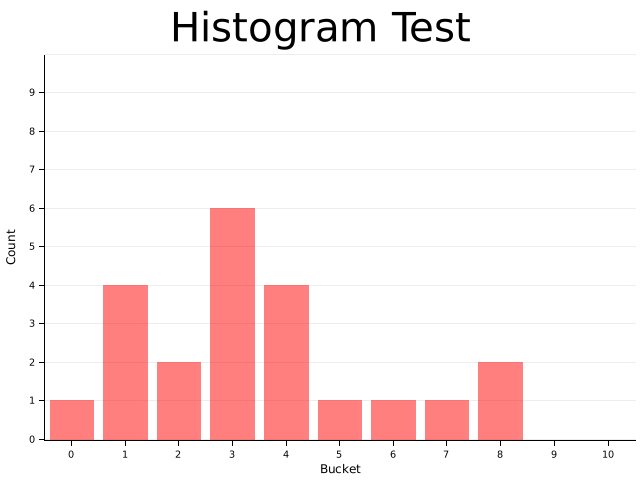
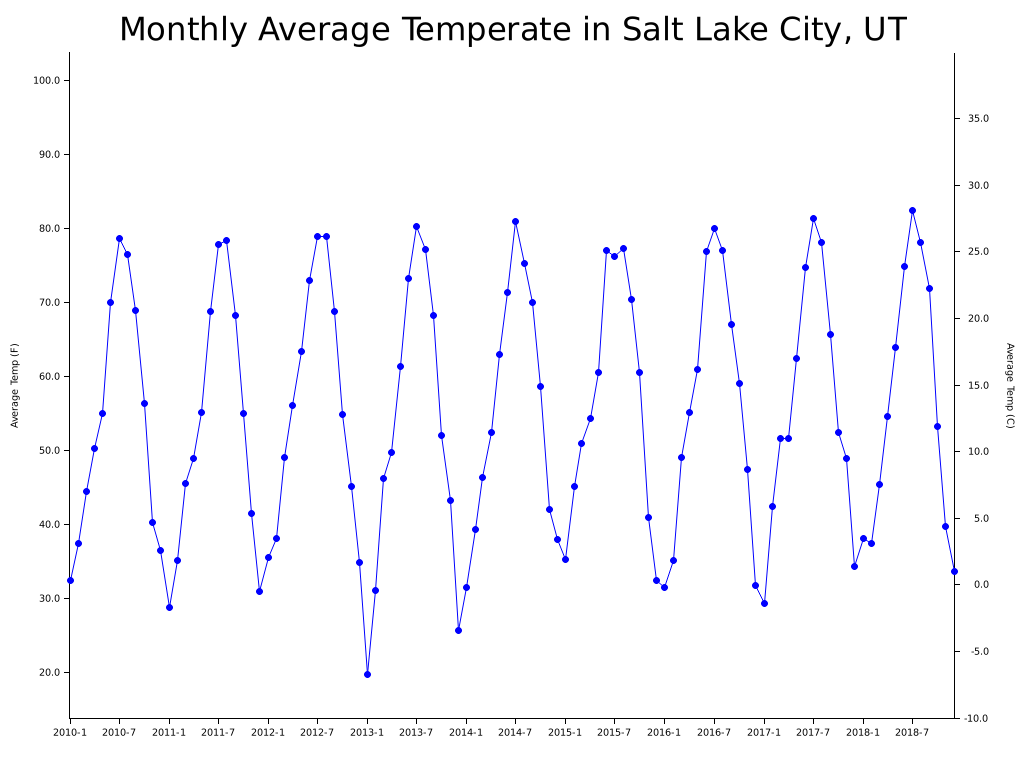
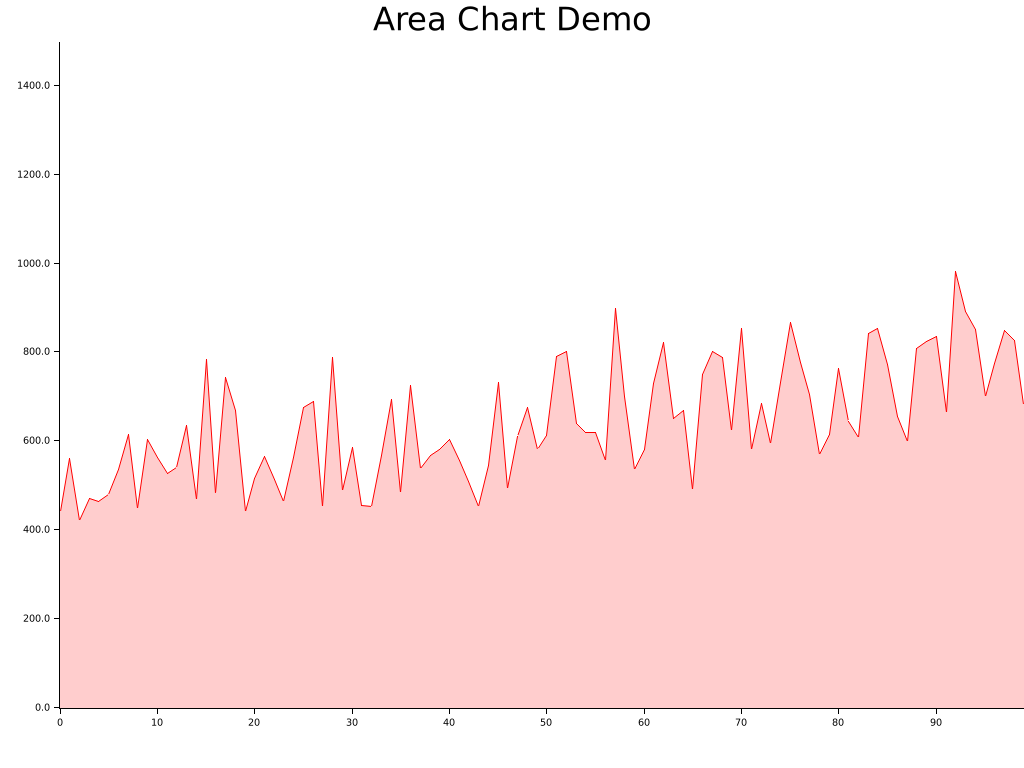
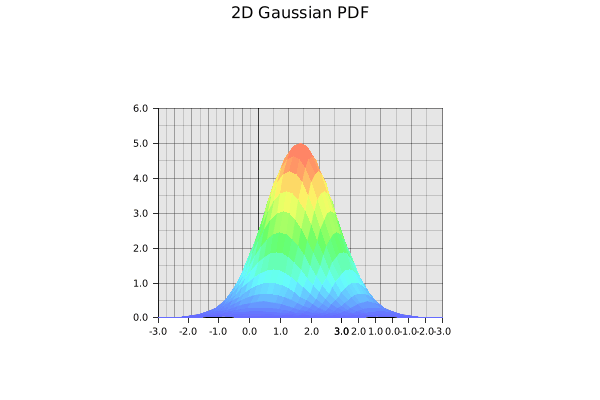
Currently, we support line series, point series, candlestick series, and histogram.
And the library is designed to be able to render multiple figure into a single image.
But Plotter is aimed to be a platform that is fully extendable to support any other types of figure.
## Concepts by examples
### Drawing Back-ends
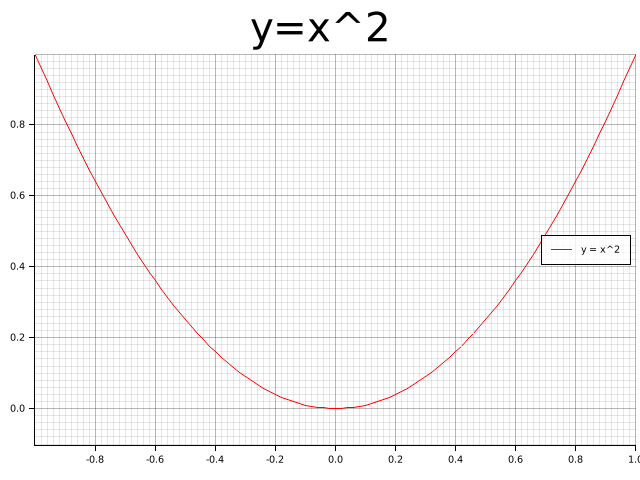
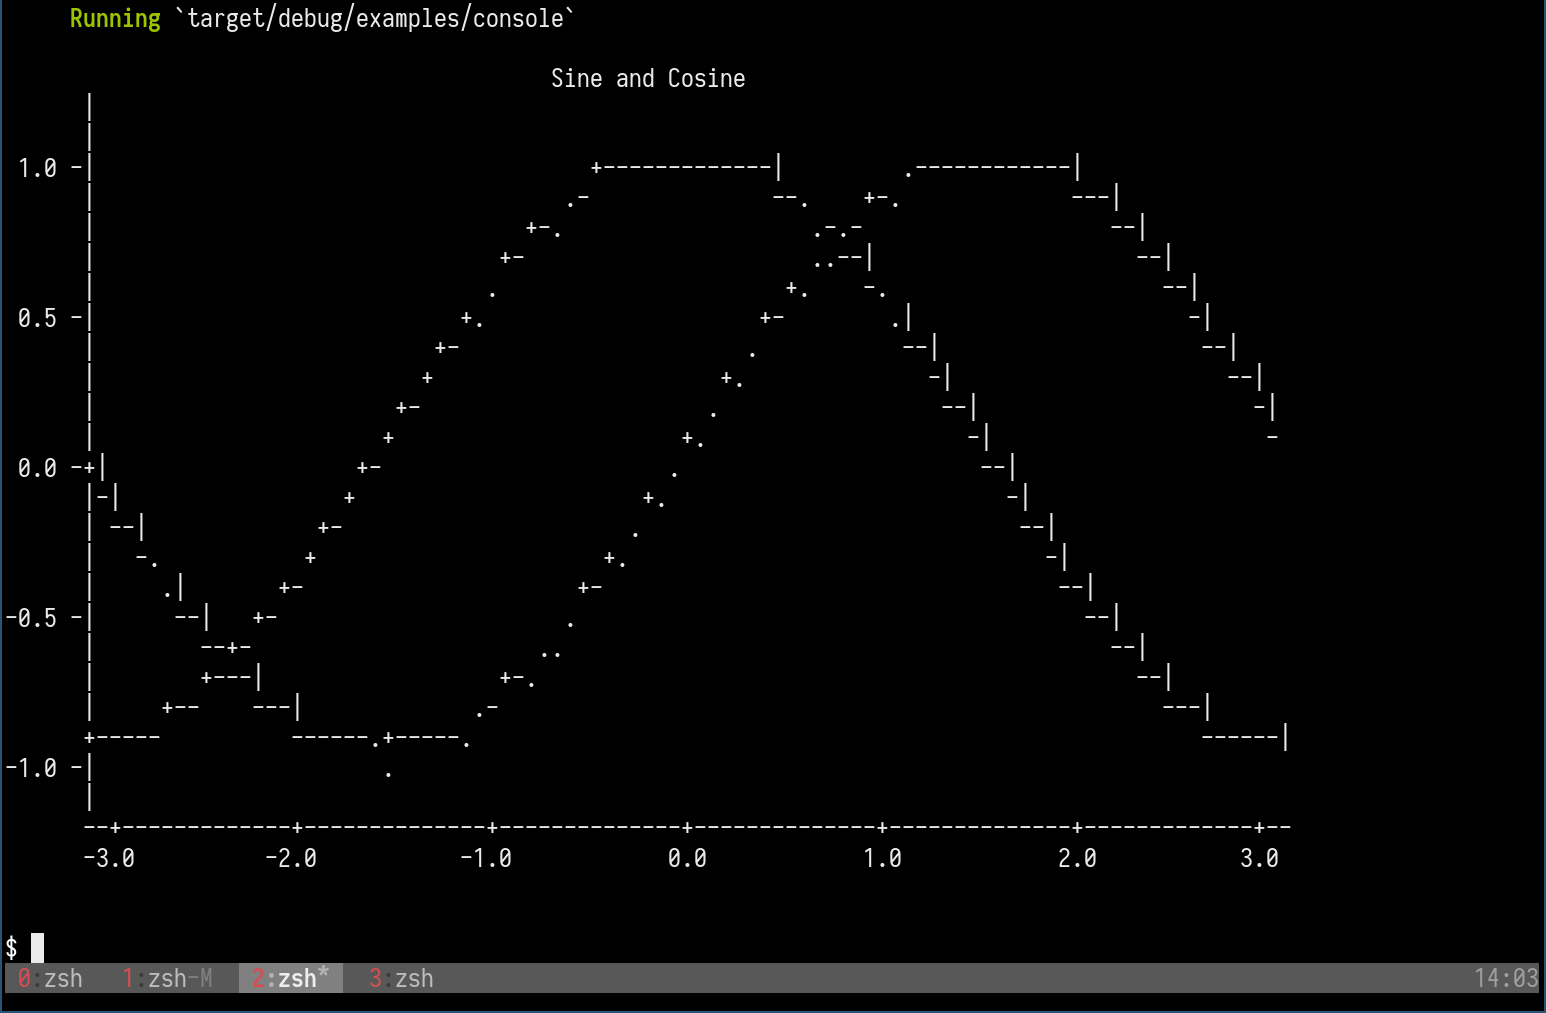
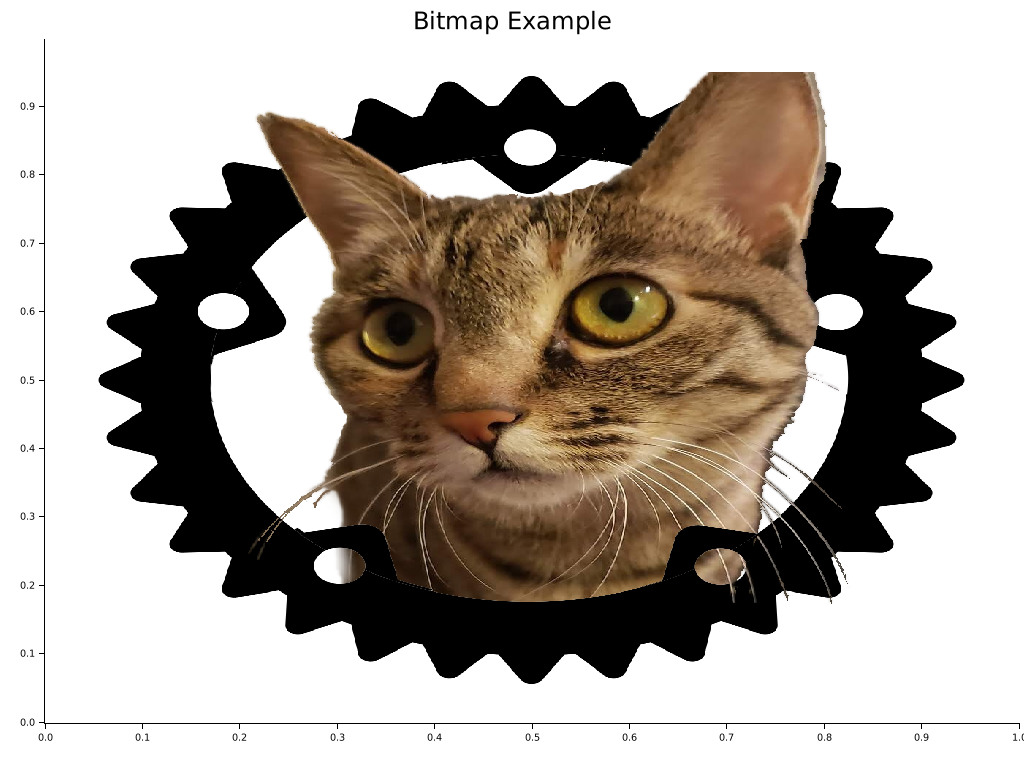
Plotters can use different drawing back-ends, including SVG, BitMap, and even real-time rendering. For example, a bitmap drawing backend.
```rust
use plotters::prelude::*;
fn main() -> Result<(), Box
## Interactive Tutorial with Jupyter Notebook
*This tutorial is now working in progress and isn't complete*
Thanks to the evcxr, now we have an interactive tutorial for Plotters!
To use the interactive notebook, you must have Jupyter and evcxr installed on your computer.
Follow the instruction on [this page](https://github.com/google/evcxr/tree/master/evcxr_jupyter) below to install it.
After that, you should be able to start your Jupyter server locally and load the tutorial!
```bash
git clone https://github.com/38/plotters-doc-data
cd plotteres-doc-data
jupyter notebook
```
And select the notebook called `evcxr-jupyter-integration.ipynb`.
Also, there's a static HTML version of this notebook available at the [this location](https://plotters-rs.github.io/plotters-doc-data/evcxr-jupyter-integration.html)
## Plotting in Rust
Rust is a perfect language for data visualization. Although there are many mature visualization libraries in many different languages.
But Rust is one of the best languages fits the need.
* **Easy to use** Rust has a very good iterator system built into the standard library. With the help of iterators,
Plotting in Rust can be as easy as most of the high-level programming languages. The Rust based plotting library
can be very easy to use.
* **Fast** If you need rendering a figure with trillions of data points,
Rust is a good choice. Rust's performance allows you to combine data processing step
and rendering step into a single application. When plotting in high-level programming languages,
e.g. Javascript or Python, data points must be down-sampled before feeding into the plotting
program because of the performance considerations. Rust is fast enough to do the data processing and visualization
within a single program. You can also integrate the
figure rendering code into your application handling a huge amount of data and visualize it in real-time.
* **WebAssembly Support** Rust is one of few the language with the best WASM support. Plotting in Rust could be
very useful for visualization on a web page and would have a huge performance improvement comparing to Javascript.
## Plotting on HTML5 canvas with WASM Backend
Plotters currently supports backend that uses the HTML5 canvas. To use the WASM support, you can simply use
`CanvasBackend` instead of other backend and all other API remains the same!
There's a small demo for Plotters + WASM available at [here](https://github.com/plotters-rs/plotters-wasm-demo).
To play with the deployed version, follow this [link](https://plotters-rs.github.io/wasm-demo/www/index.html).
## What types of figure are supported?
Plotters is not limited to any specific type of figure.
You can create your own types of figures easily with the Plotters API.
But Plotters provides some builtin figure types for convenience.
Currently, we support line series, point series, candlestick series, and histogram.
And the library is designed to be able to render multiple figure into a single image.
But Plotter is aimed to be a platform that is fully extendable to support any other types of figure.
## Concepts by examples
### Drawing Back-ends
Plotters can use different drawing back-ends, including SVG, BitMap, and even real-time rendering. For example, a bitmap drawing backend.
```rust
use plotters::prelude::*;
fn main() -> Result<(), Box