README.md
1# Perfetto SDK example project
2
3This directory contains an example project using the [Perfetto
4SDK](https://perfetto.dev/docs/instrumentation/tracing-sdk). It demonstrates
5how to instrument your application with track events to give more context in
6developing, debugging and performance analysis.
7
8Dependencies:
9
10- [CMake](https://cmake.org/)
11- C++17
12
13## Building
14
15First, check out the latest Perfetto release:
16
17```bash
18git clone https://android.googlesource.com/platform/external/perfetto -b v34.0
19```
20
21Then, build using CMake:
22
23```bash
24cd perfetto/examples/sdk
25cmake -B build
26cmake --build build
27```
28
29Note: If amalgamated source files are not present, generate them using
30`cd perfetto ; tools/gen_amalgamated --output sdk/perfetto`.
31[Learn more](https://perfetto.dev/docs/contributing/sdk-releasing#building-and-tagging-the-release)
32at the release section.
33
34## Track event example
35
36The [basic example](example.cc) shows how to instrument an app with track
37events. Run it with:
38
39```bash
40build/example
41```
42
43The program will create a trace file in `example.perfetto-trace`, which can be
44directly opened in the [Perfetto UI](https://ui.perfetto.dev). The result
45should look like this:
46
47
49
50## System-wide example
51
52While the above example only records events from the program itself, with
53Perfetto it's also possible to combine app trace events with system-wide
54profiling data (e.g., ftrace on Linux). The repository has a [second
55example](example_system_wide.cc) which demonstrates this on Android.
56
57Requirements:
58- [Android NDK](https://developer.android.com/ndk)
59- A device running Android Pie or newer
60
61> Tip: It's also possible to sideload Perfetto on pre-Pie Android devices.
62> See the [build
63> instructions](https://perfetto.dev/docs/contributing/build-instructions).
64
65To build:
66
67```bash
68export NDK=/path/to/ndk
69cmake -DCMAKE_TOOLCHAIN_FILE=$NDK/build/cmake/android.toolchain.cmake \
70 -B build_android
71cmake --build build_android
72```
73
74Next, plug in an Android device into a USB port, download the example and run
75it while simultaneously recording a trace using the `perfetto` command line
76tool:
77
78```bash
79adb push build_android/example_system_wide ../system_wide_trace_cfg.pbtxt \
80 /data/local/tmp/
81adb shell "\
82 cd /data/local/tmp; \
83 rm -f /data/misc/perfetto-traces/example_system_wide.perfetto-trace; \
84 cat system_wide_trace_cfg.pbtxt | \
85 perfetto --config - --txt --background \
86 -o
87 /data/misc/perfetto-traces/example_system_wide.perfetto-trace; \
88 ./example_system_wide"
89```
90
91Finally, retrieve the resulting trace:
92
93```bash
94adb pull /data/misc/perfetto-traces/example_system_wide.perfetto-trace
95```
96
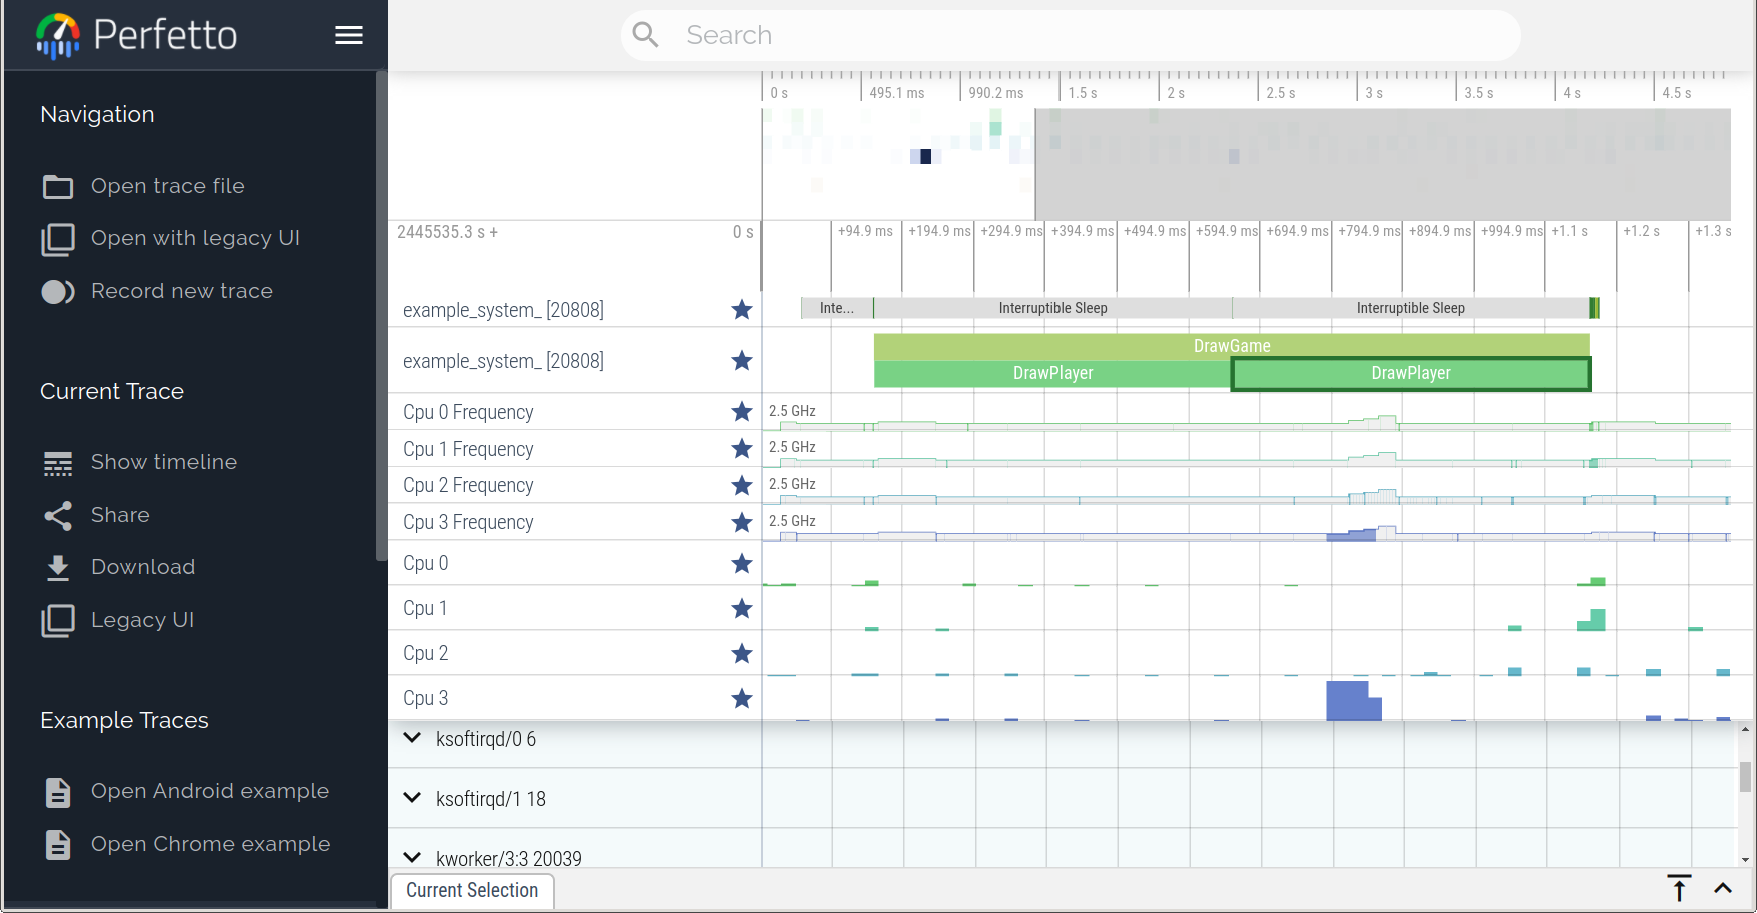
97When opened in the Perfetto UI, the trace now shows additional contextual
98information such as CPU frequencies and kernel scheduler information.
99
100
102
103> Tip: You can generate a new trace config with additional data sources using
104> the [Perfetto UI](https://ui.perfetto.dev/#!/record) and replace
105> `system_wide_trace_cfg.pbtxt` with the [generated config](
106> https://ui.perfetto.dev/#!/record/instructions).
107
108## Custom data source example
109
110The [final example](example_custom_data_source.cc) shows how to use an
111application defined data source to emit custom, strongly typed data into a
112trace. Run it with:
113
114```bash
115build/example_custom_data_source
116```
117
118The program generates a trace file in `example_custom_data_source.perfetto-trace`,
119which we can examine using Perfetto's `traceconv` tool to show the trace
120packet written by the custom data source:
121
122```bash
123traceconv text example_custom_data_source.perfetto-trace
124...
125packet {
126 trusted_uid: 0
127 timestamp: 42
128 trusted_packet_sequence_id: 2
129 previous_packet_dropped: true
130 for_testing {
131 str: "Hello world!"
132 }
133}
134...
135```
136